The Collection / Coordination
CoordinationTwo Years on One Screen
Every internal deadline for a Diploma cohort in one place, a workload chart that marks the worst month while there is still time to move something, and a ready-to-open copy you can publish to your whole school community.
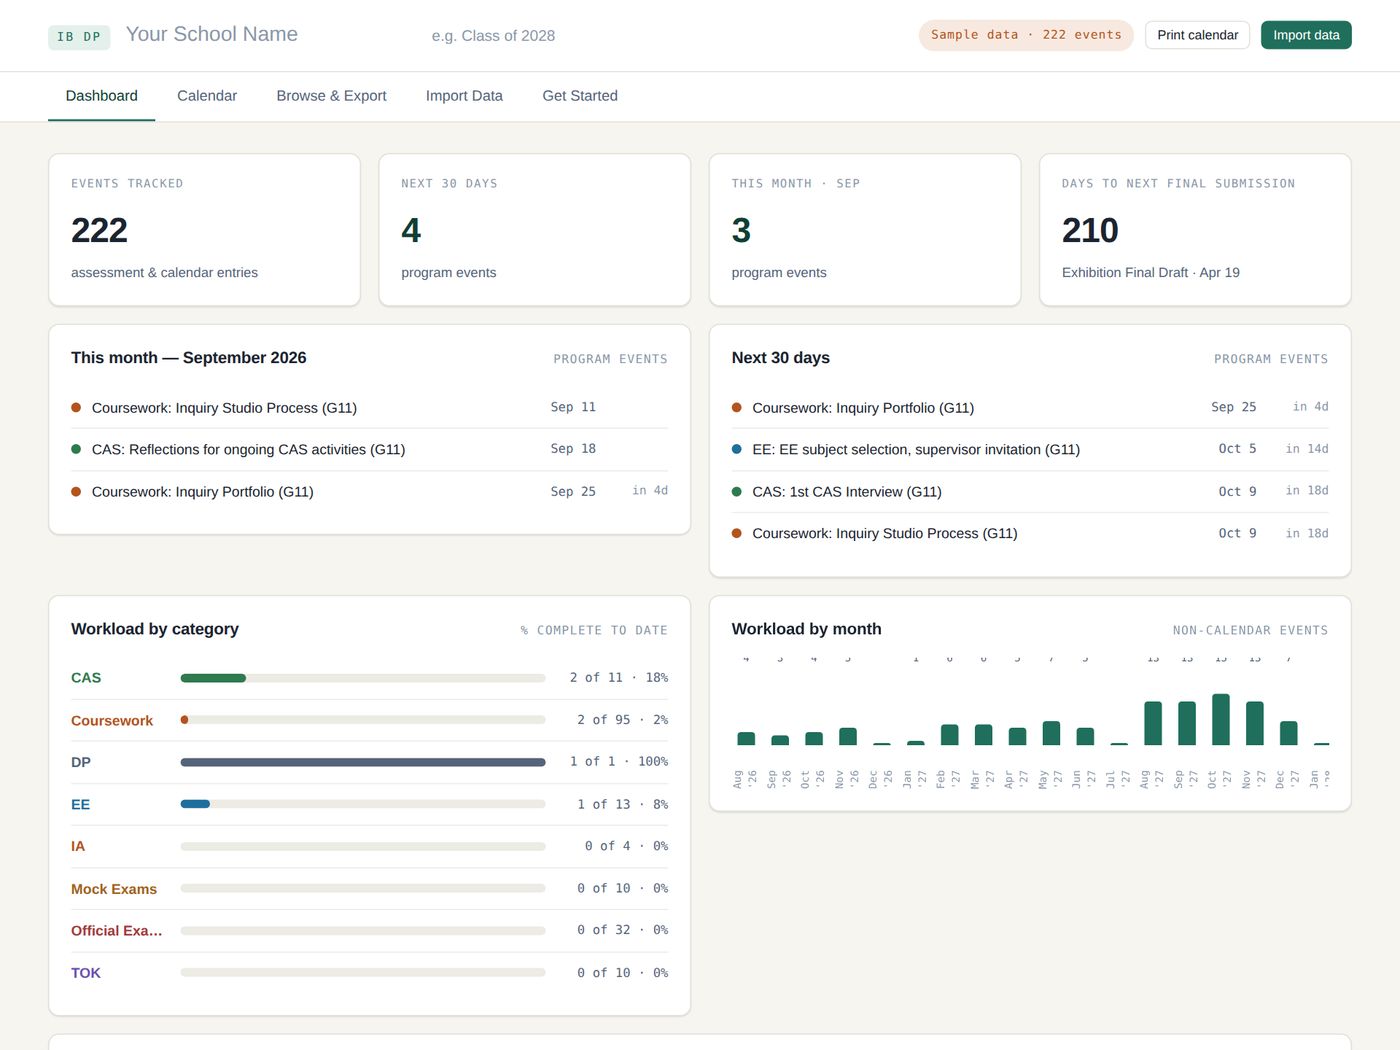
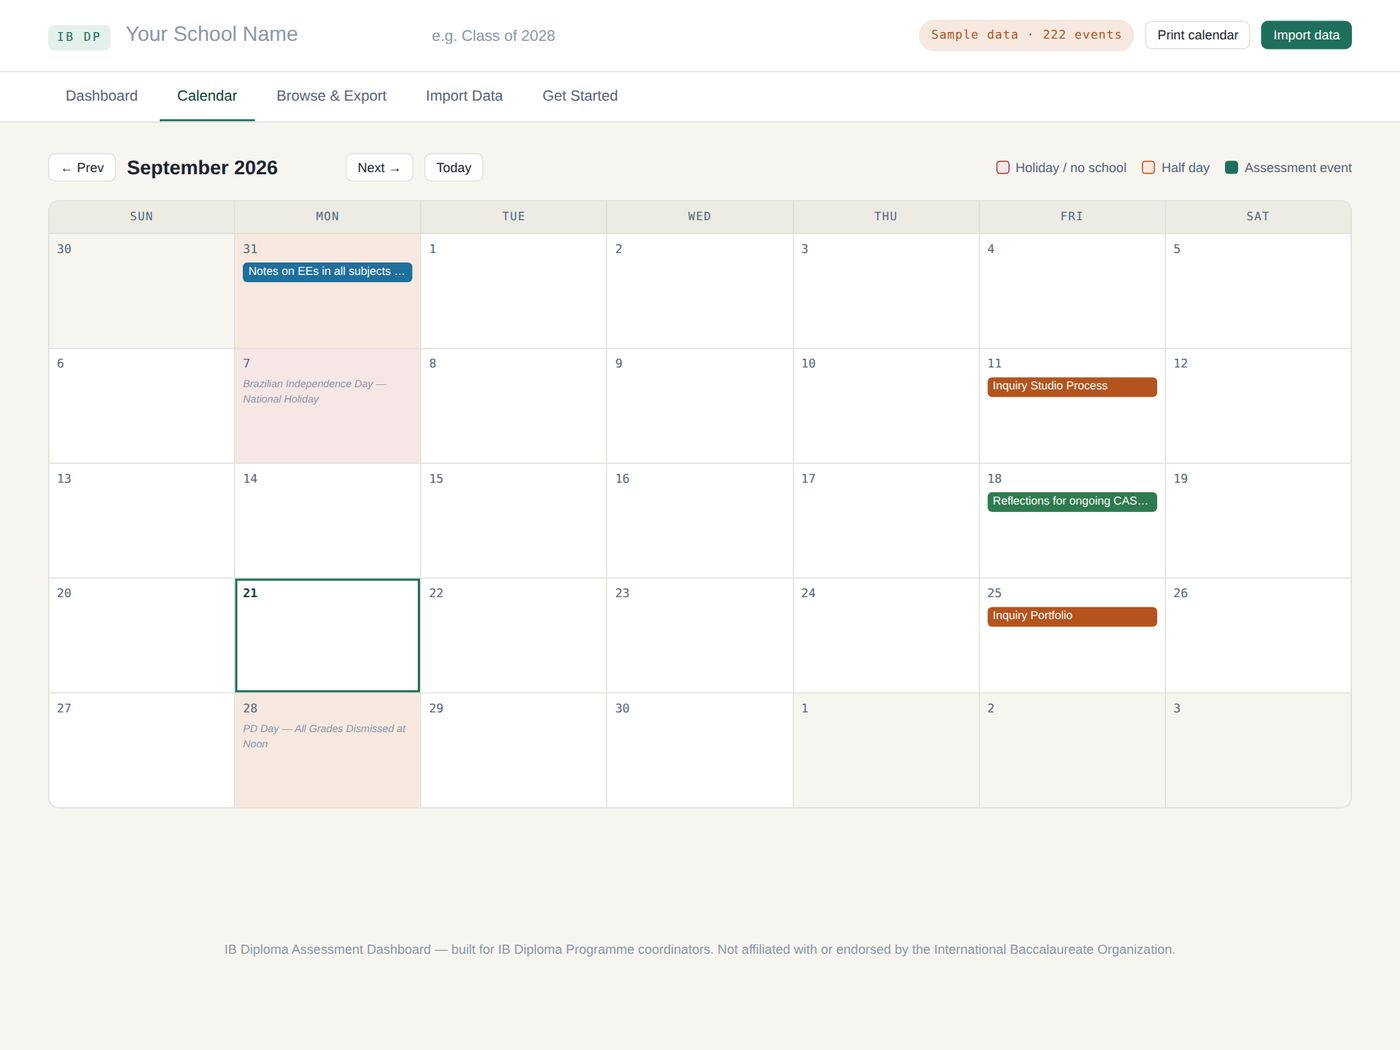
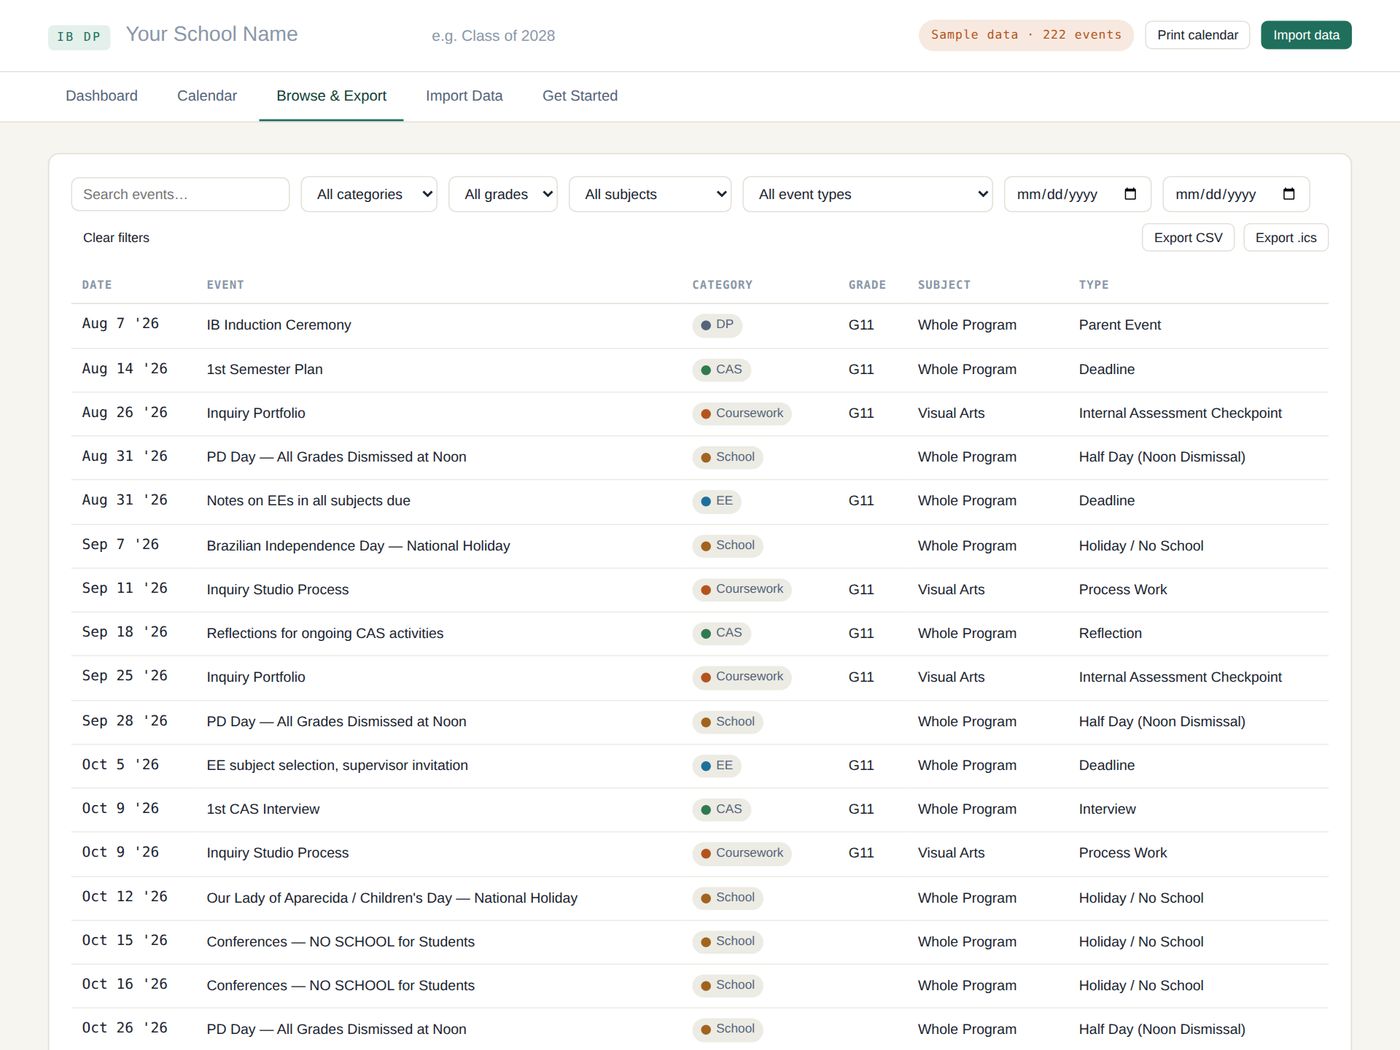
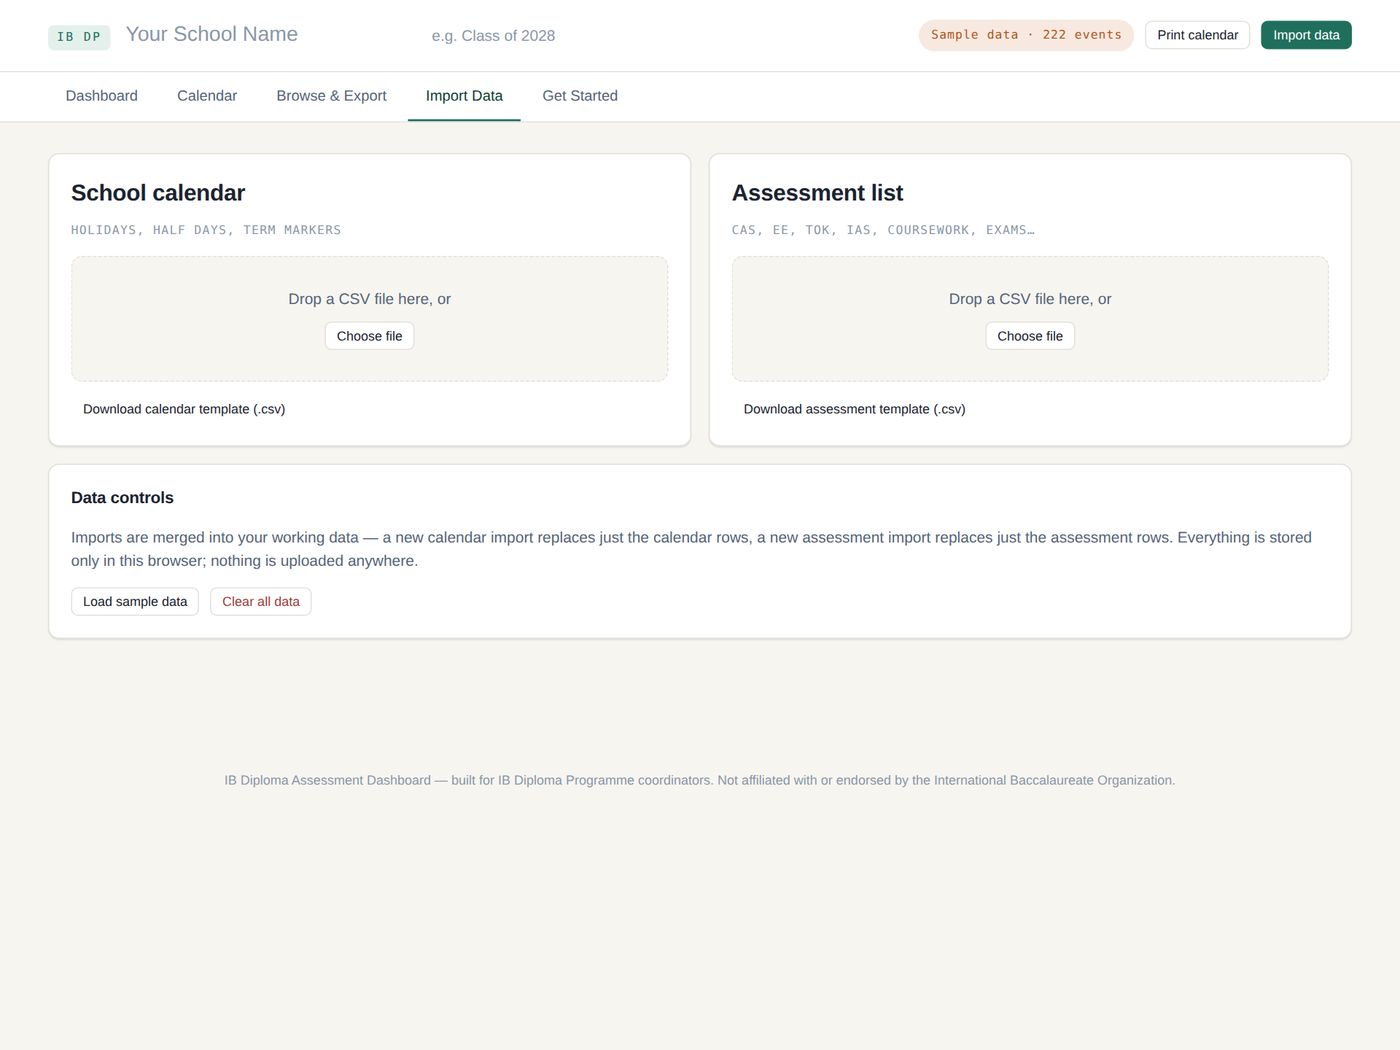
All five views, shown with the sample data
The problem
Every coordinator knows the autumn of Year 2. Internal assessments, the Extended Essay final draft, the TOK essay and a round of mock exams all land within a few weeks of each other, and by the time anyone notices, the dates are published, in parents' calendars, and very hard to move.
The information was never missing. It was scattered — a date in one department's scheme of work, another in an email thread, a third in a subject teacher's head — and no single view existed in which the pile-up was visible before it arrived.
What it does
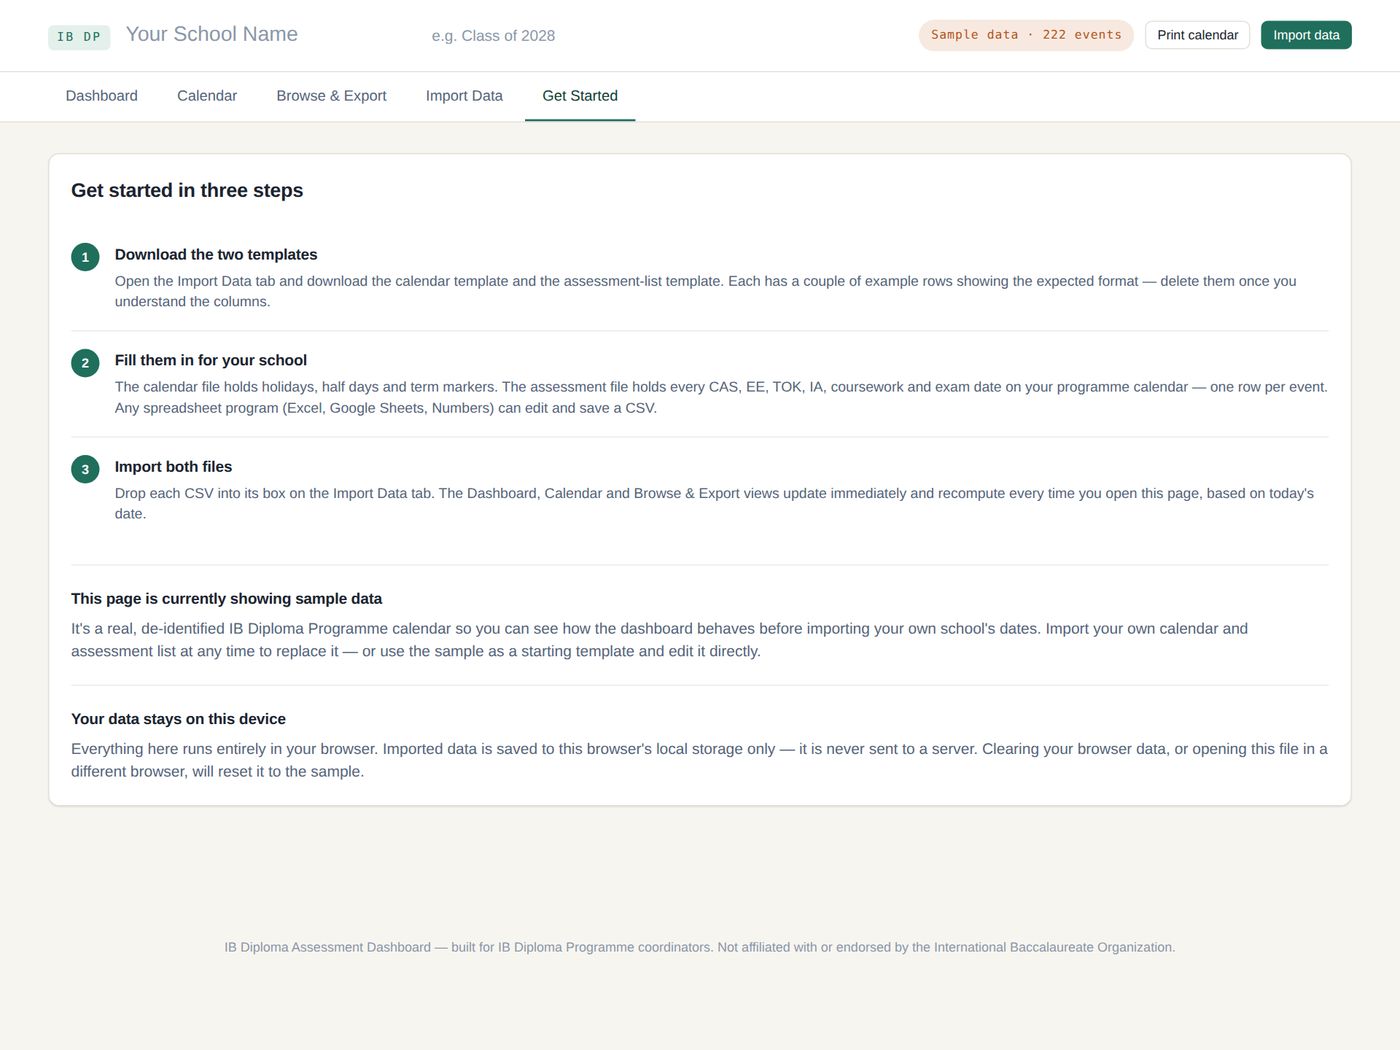
You keep two spreadsheets: the school calendar (holidays, half days, term markers) and the assessment list (every CAS, EE, TOK, IA, coursework and exam date, one row per event). Drop both into the dashboard, and five views build themselves.
The dashboard counts what's due this month and in the next thirty days, shows progress through each component, lists the next five final submissions with the days remaining, and charts workload month by month across both years — with the heaviest month highlighted. That highlight is the point of the whole tool. Seen in the summer, it's a decision a department can still make. Seen in October, it's a description of a problem.
The calendar lays out any month with holidays, half days and assessments distinguished, and prints cleanly for a staffroom wall.
Publish it to your school
The first version stopped at the coordinator's desk. The data lived in one browser, so anyone else who wanted to see it needed your spreadsheets and ten minutes of importing — which meant, in practice, nobody did.
Now, once your dates are in, Export populated HTML writes a new copy of the dashboard with your calendar and assessment list built in, named after your school and cohort. Post it on the school website or learning platform, or attach it to an email. Students, parents and teachers open it and see your program's dates straight away, with nothing to import and no account to make. When a date moves, re-export and replace the file.
Each published copy keeps its own storage, so a parent who fiddled with last month's copy still sees the right dates when this month's arrives.
Or send each teacher only their subject
A coordinator's calendar is not much use to a Biology teacher, because most of it is somebody else's problem. So the browse view filters by category, grade, subject and event type — and then exports what you've filtered, either as a spreadsheet or as an .ics calendar file.
Filter to Biology, export, send the file. The teacher opens it and every Biology deadline for both years lands in the Google Calendar or Outlook they already use. Nobody has to learn a new tool, and nobody has to maintain seventeen separate subject calendars — which is how these systems usually die by November.
One thing to know: an .ics file is a one-time import, not a live subscription. If a date changes, send the new file and ask teachers to delete the old events first, or they'll end up with both.
Everything here runs entirely in your browser. Imported data is saved to this browser's local storage only — it is never sent to a server.
Why it runs locally
It's a single HTML file. No accounts, no subscription, no server, and no data leaving the building — which also means no IT approval process and no data-protection conversation, because there is nothing to approve. Open the file in any browser and it works, including offline.
The honest trade-off: whatever you import lives in the browser you import it into. Switch computers or clear your browser data and it resets. So treat the two spreadsheets as your master copy and the dashboard as a view of them — re-importing takes seconds, and the spreadsheets are the thing you back up. A published copy is the same kind of thing: a snapshot of the day you exported it, which won't update itself.
What's in it
- The dashboard file — five views: Dashboard, Calendar, Browse & Export, Import Data and Get Started
- A publish button — exports a copy of the dashboard with your school's data already inside, ready to share
- Two CSV templates — downloadable from inside the tool, each with example rows showing the expected format
- A complete sample program — a full two-year calendar preloaded, so you can see every view working before you enter a single date of your own
Every view recalculates against today's date whenever you open it, so the counters, the next-thirty-days list and the milestone countdowns are always current without anyone updating anything.
Who it's for
DP coordinators first, and heads of department who want a clear view of their own subject's two-year load. The templates edit in Excel, Google Sheets or Numbers — anything that saves a CSV.
Setup is honestly an afternoon: most of it is entering your events into the assessment template. The dashboard starts being useful long before that list is complete, though — a term's worth of dates is enough for the month chart to start telling you something.
The one thing it won't do is tell you what to move. That's a conversation with a department, and it goes better when you're holding a chart than when you're holding an opinion.
It's free while the publishing feature is new. If you try it with your own school's dates, I'd like to know what broke, what confused you, and whether anyone in your community actually opened it. Write to me here.
Acquire
Free One file · works offline · no accountA single HTML file. Try it here with the sample data, or download it, import your two spreadsheets, and publish a copy for your school. Not affiliated with or endorsed by the International Baccalaureate Organization.